Quick Take
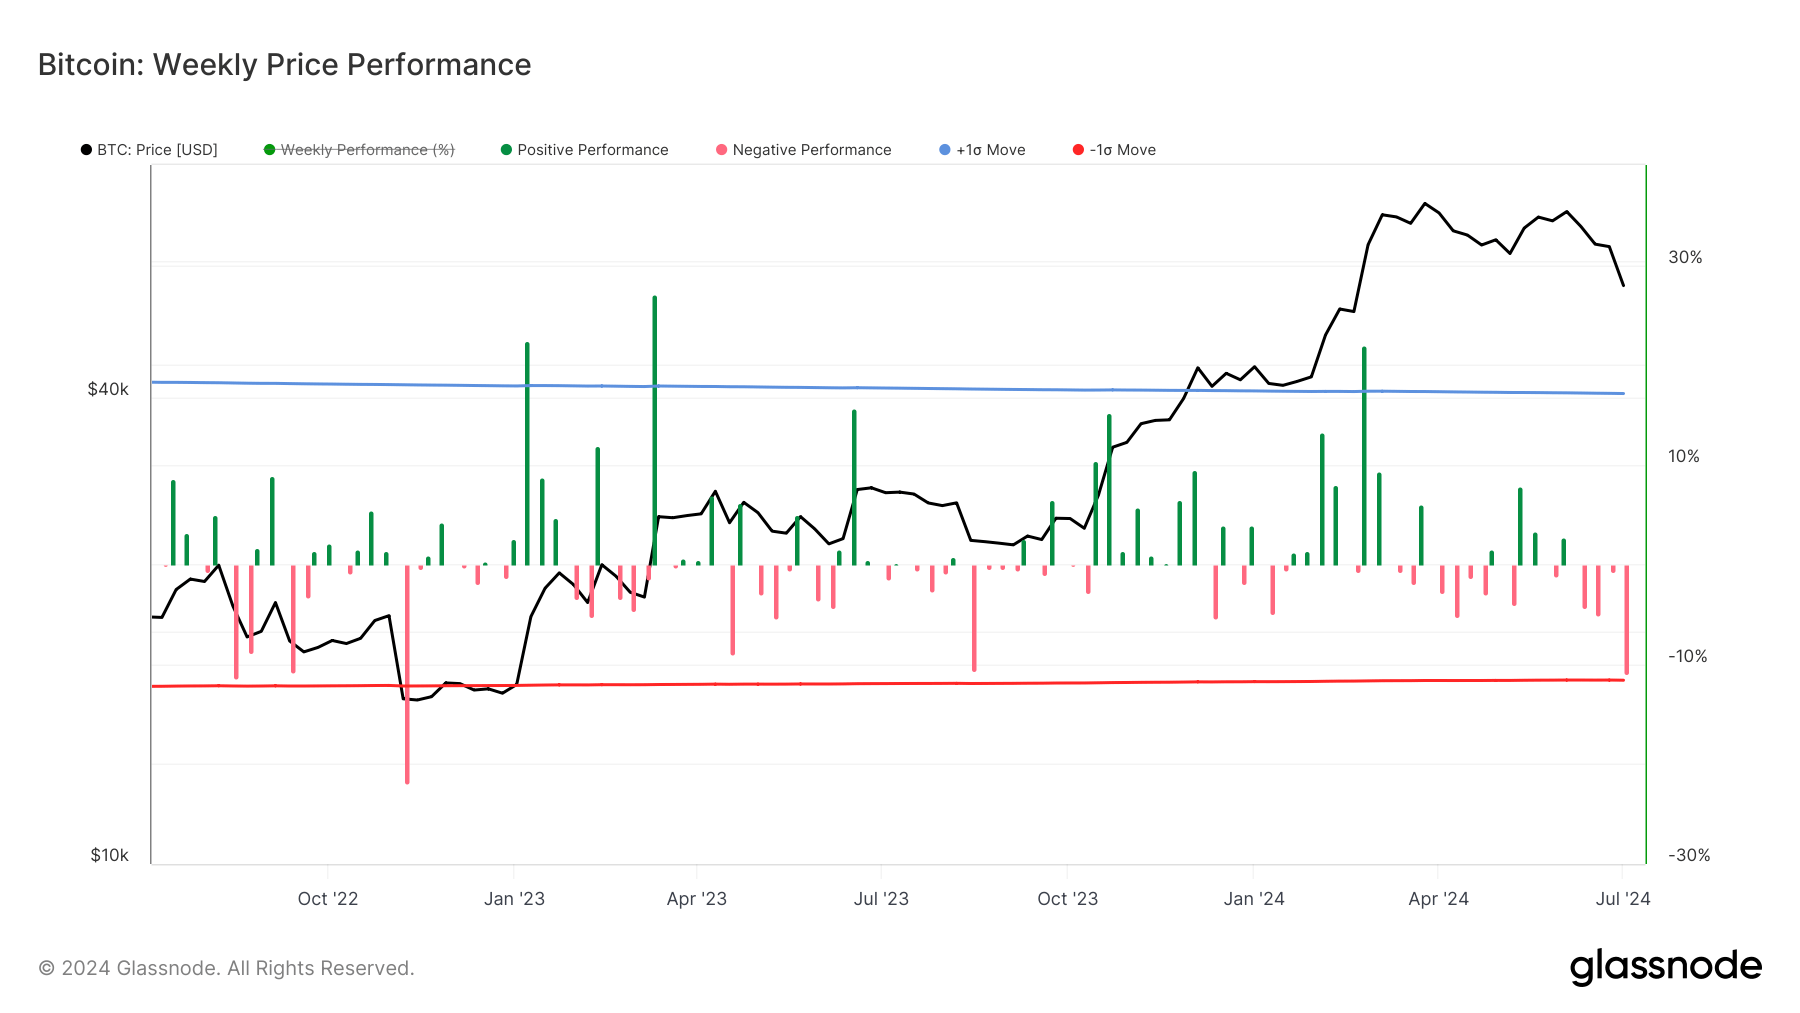
Bitcoin experienced an 11% correction in the first week of July, marking its worst weekly performance since the FTX collapse in November 2022, when it plummeted by approximately 22%.
This recent decline also mirrors the drawdown of August 2023, where Bitcoin fell below the 200-day moving average and consolidated for several months before beginning a recovery in October. A similar pattern could emerge, with Bitcoin consolidating throughout the summer before potentially climbing in the fourth quarter.
Bitcoin has now experienced four consecutive weeks of decline. The last time it had five straight weeks of losses was in the first half of 2022.

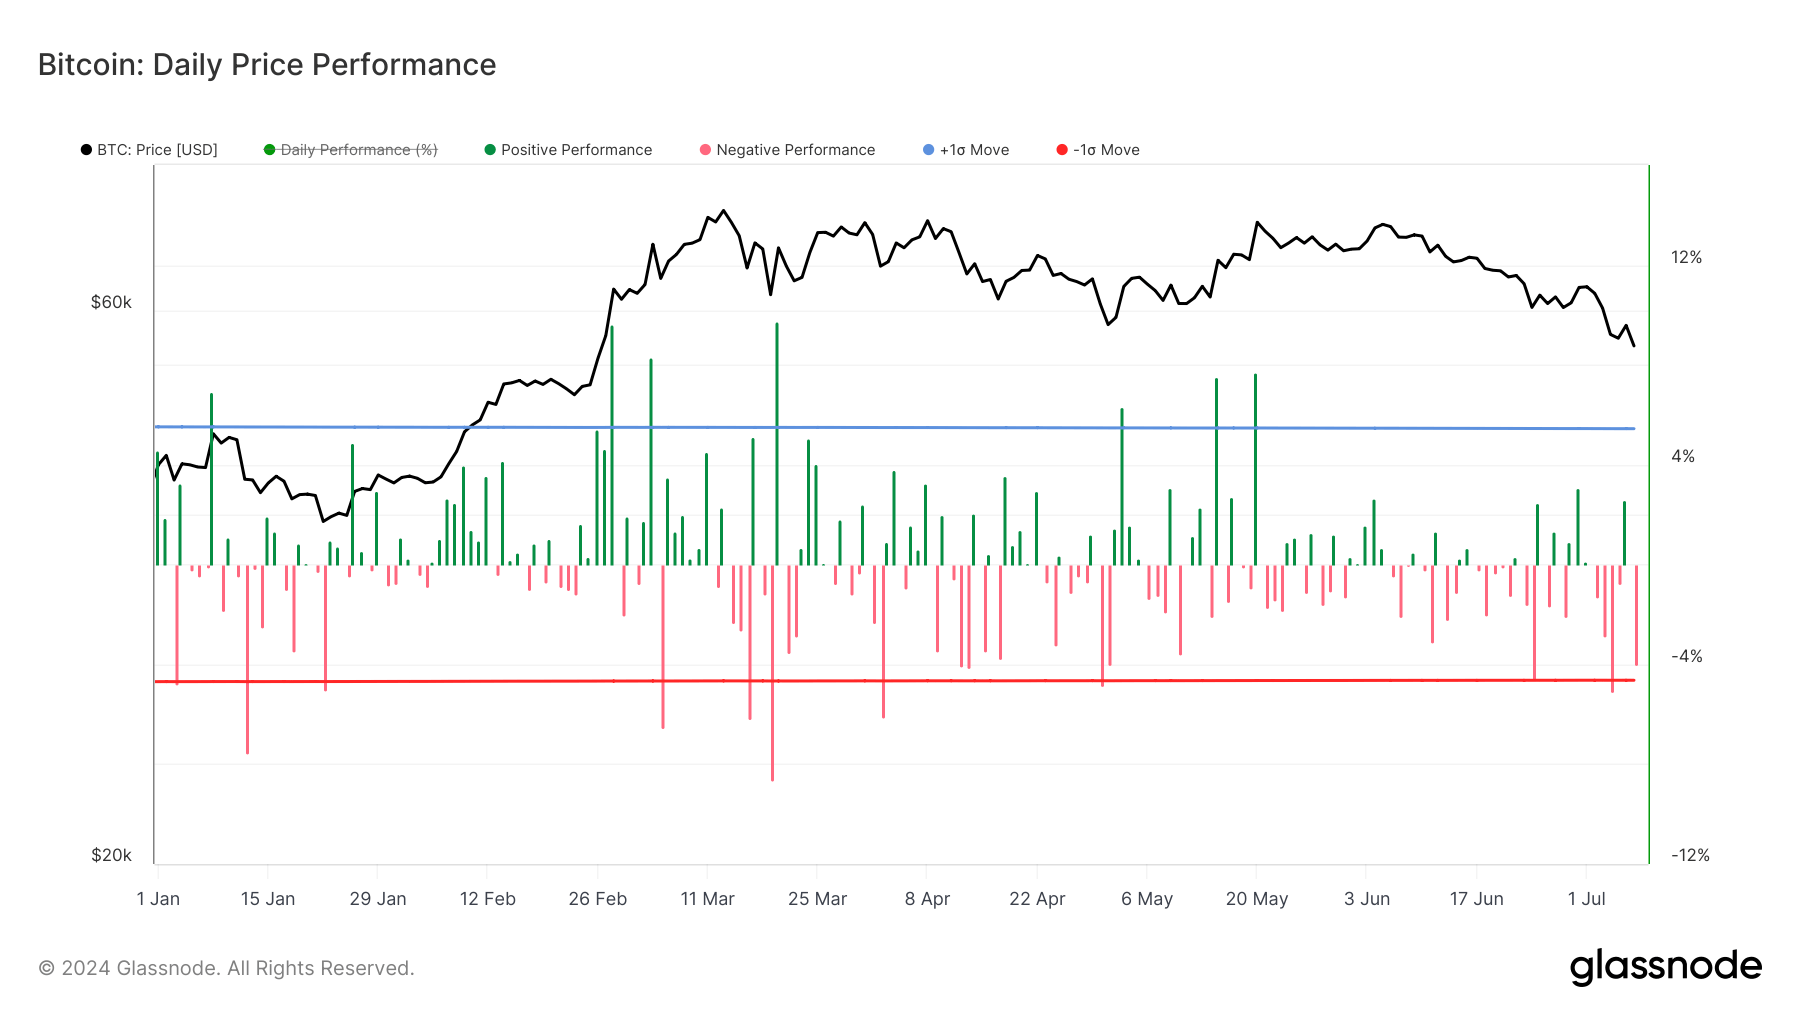
CryptoSlate highlighted that during the 2017 bull run, Bitcoin experienced multiple daily corrections of 5%, a trend that appears to be reoccurring. On June 24, Bitcoin nearly dropped 5%, followed by a decline of over 5% on July 4 and a 4% drop on July 7.

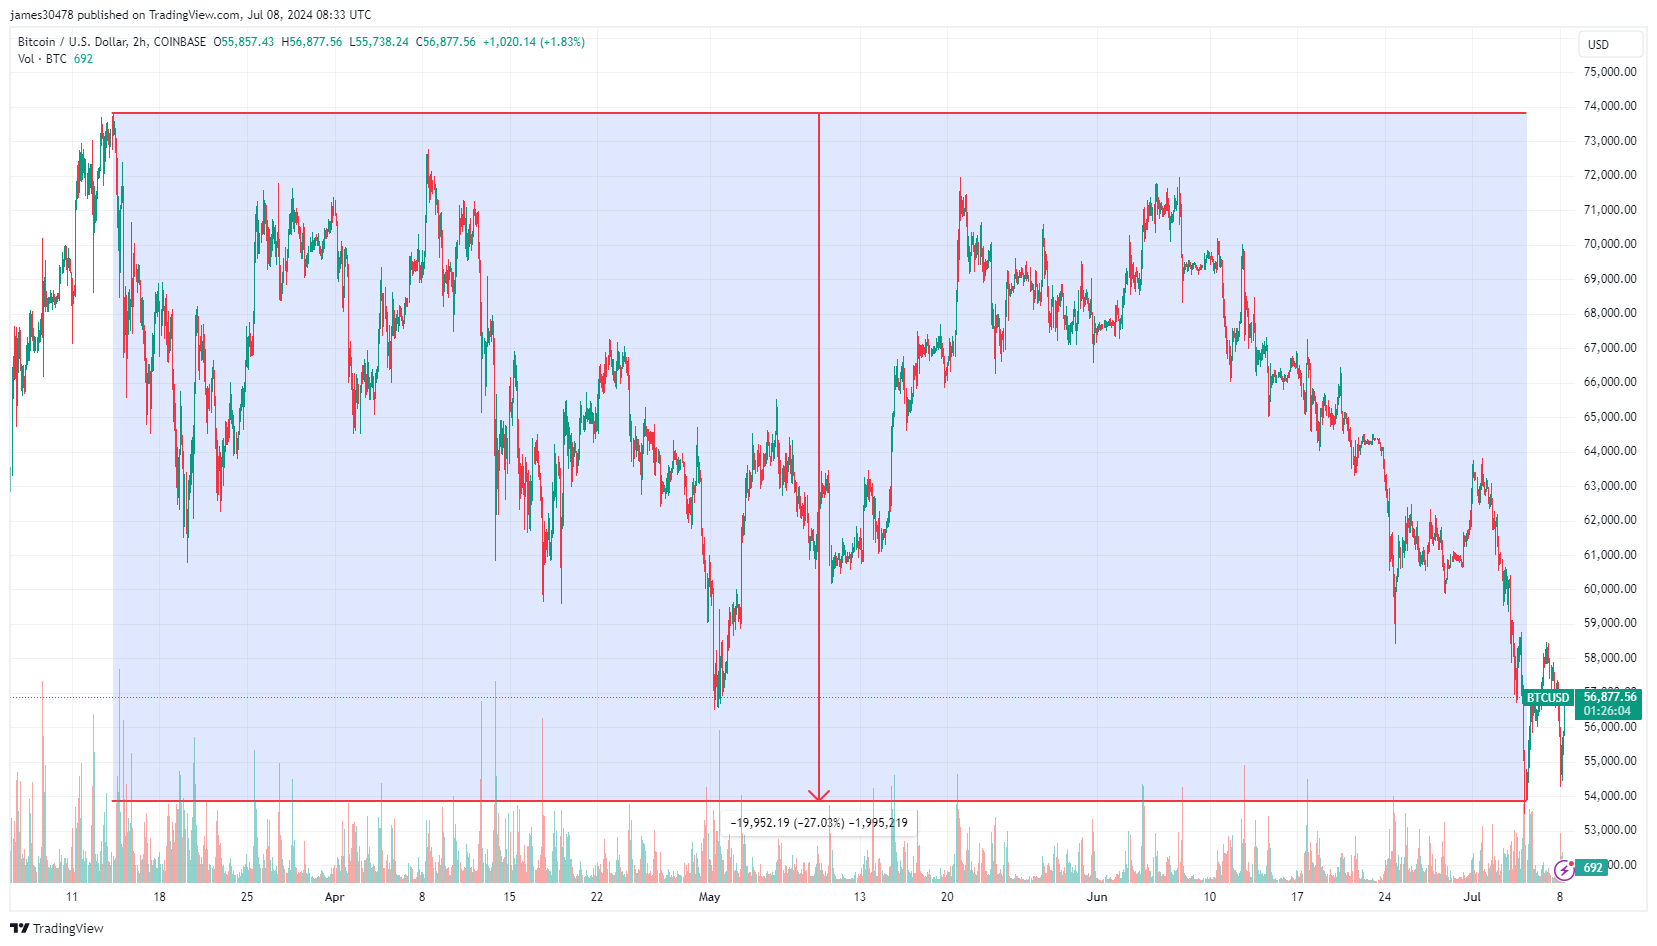
Currently, Bitcoin is 23% below its all-time high, with the most significant drawdown reaching 27% when it dipped just below $54,000. This pattern of frequent corrections and potential for consolidation suggests that the market could see stabilization before any significant upward movement.

The post 4 straight weekly declines for Bitcoin evokes 2017 bull run patterns appeared first on CryptoSlate.
